Self-Service Reports
Use self-service reports to create custom reports that you can save, modify, and run as needed.
-
On the top menu bar, click Analytics > Self-Service Reports.
- On the Self Service Reports window, in the upper right corner, click New.
-
In the Create Report For dropdown, choose to create a report for either tickets or items:
Create Report for Description Tickets Tickets are sent from one call centers into the system to be processed by member companies and locators [List of your company's forms/items] Items are based on forms created by your company - Fill in the fields. See Modify Self-Service Reports, step 4, below
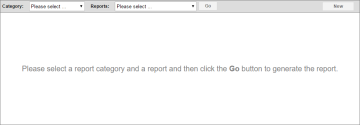
- On the Self-Service Reports window, in the Category dropdown, click the Category (ticket or item) containing the report
- In the Reports dropdown, click the name of the report and click Go. Result: The report appears
- In the upper right corner, click Modify. Result: The report appears in editable app
-
In the Selection pane on the left, choose the fields for the report. Click the plus signs ( + ) to find the fields. Only the most common fields are documented
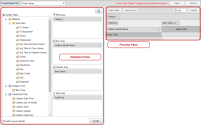
Selection and Preview panes
 Ticket Fields
Click the plus signs ( + ) to find the fields
The most commonly-used fields are the Measures/Ticket Facts fields. Fields in the Measures folder can be put only in the Data area. The Data area accepts only fields from the Measures folder
 Item Fields
Click the plus signs ( + ) to find the fields. Fields vary by company. For information about fields, consult your administrator.
Some forms allow you to select fields from components. In these cases, the component is listed after the form and separated by a semicolon. Example: Category - AppName; ComponentName
- Optional: Configure fields and sections in the Selection pane. In the upper right corner of the Selection pane, click Configure (
 ) .
) . - Optional. In the bottom left corner of the Selection pane, check the Defer Layout Update box to make your changes appear in the Preview pane in the upper right corner only when you click Update. If unchecked, the window reloads to show each change
-
Drag and drop the fields into the areas to build the report. You can also drag and drop fields to change their order in areas.
To remove fields, drag and drop them back into the folders they came from.
- Measures fields can be used only in the Data area
- All other fields can be used in the Filter, Row, and Column areas
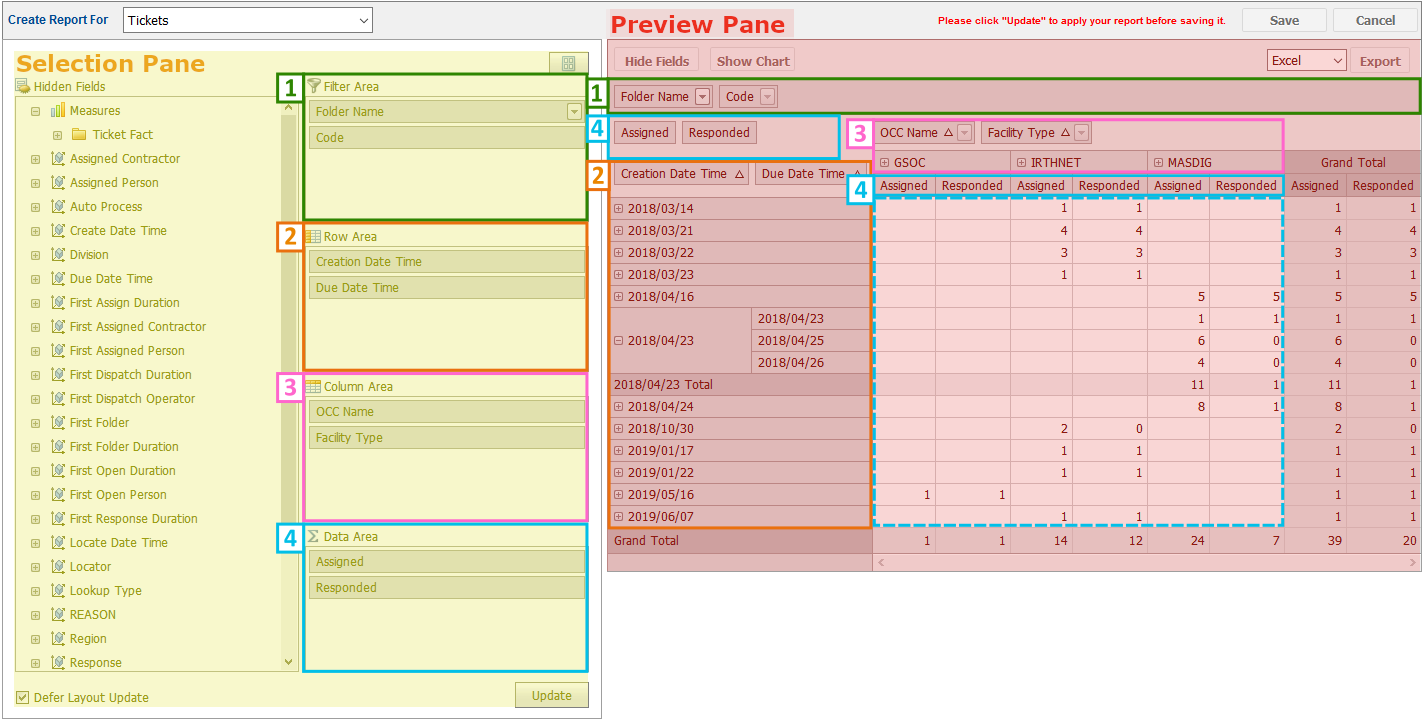
Area Key to Screen Description Both Panes (Reorder) Preview Pane (Change, sort, show/hide) Filter

1
Filters limit the search results before the data is put into the columns. For example, limiting by folder name means that only data from tickets in the folders you chose will appear in the report
- Field/value box (
 ): Drag and drop to reorder fields
- Dropdown list
 : Change the data displayed (choose folder, code, one call center, facility type, etc)
Row

2
The first column that contains the row headings. The fields you put here in order (top to bottom) are the row headings top to bottom when the report is created
- Field/value box (
 ): Drag and drop to reorder fields
- Sort
 : Change sort order
 - +/- (Row heading): Show/hide additional values/fields/dates
Column

3
The top row that contains the column headings. The fields you put here in order (top to bottom) are the column headings (top row, left to right) when the report is created
- Field/value box (
 ): Drag and drop to reorder fields
- Dropdown list
 : Use to change the data displayed (choose folder, code, one call center, facility type, etc)
 - Sort
 : Change sort order
 - +/- (Column heading): Switches between values/fields
Data

4
Fields in the Data area make up the body of the report (indicated in the Preview Pane with white cells inside the blue dotted line). These cells contain the number of tickets that contain the field or meet the criteria. Only Measures fields can be used in the Data Area.
If there are multiple fields in the Data area, they display in the Preview Pane as subcolumns of the Filter columns (indicated in the Preview Pane with the solid blue line above the white cells enclosed by the dotted blue line)
- Field/value box (
 ): Drag and drop to reorder fields
- Not applicable

- In the bottom right corner of the Selection pane, click Update.
-
Actions are at the top of the Preview pane:
Action Description Export Choose the file format of the export:
- Excel: Microsoft spreadsheet file (.xlsx)
- Mht: A web page archive format that stores all files needed to display an HTML page (HTML, images, Java, Flash, audio files, etc.)(.mhtml)
- PDF: Portable Document Format; an Adobe file format that stores the complete description of a fixed layout document (text, images, layout, etc.)(.pdf)
- Rtf: Rich Text Format (.rtf)
- Text (.txt)
Hide/Show Fields Hides or shows the Selection pane (on the left of the page) Save Reports can be saved so you can run them again. Reports are saved according to their category (ticket or item) Show Chart Type: Choose type of chart 49 chart options
Series: Switch between using rows and columns for the X (horizontal) and Y (vertical) axis of the chart
Total: Include data totals
Labels: Include labels
- On the Self-Service Reports window, in the Category dropdown, click the Category (ticket or item) containing the report
- In the Reports dropdown, click the name of the report and click Go. Result: The report appears
- On the Self-Service Reports window, in the Category dropdown, click the Category (ticket or item) containing the report
- In the Reports dropdown, click the name of the report and click Go. Result: The report appears
- In the upper right corner, click Delete

